| Info |
|---|
| Note: The teams working on Union VMS try to keep the manual as up-to-date as possible. If you see any differences in the current GUI, please help us by contributing to the manual with the latest information. |
...
The "Reports" in the main menu shows a live view over were reporting assets are located. This page displays all the accessible reports for the user. The "Reports" page is divided into "Line view" and "Reports"
Live view
Map
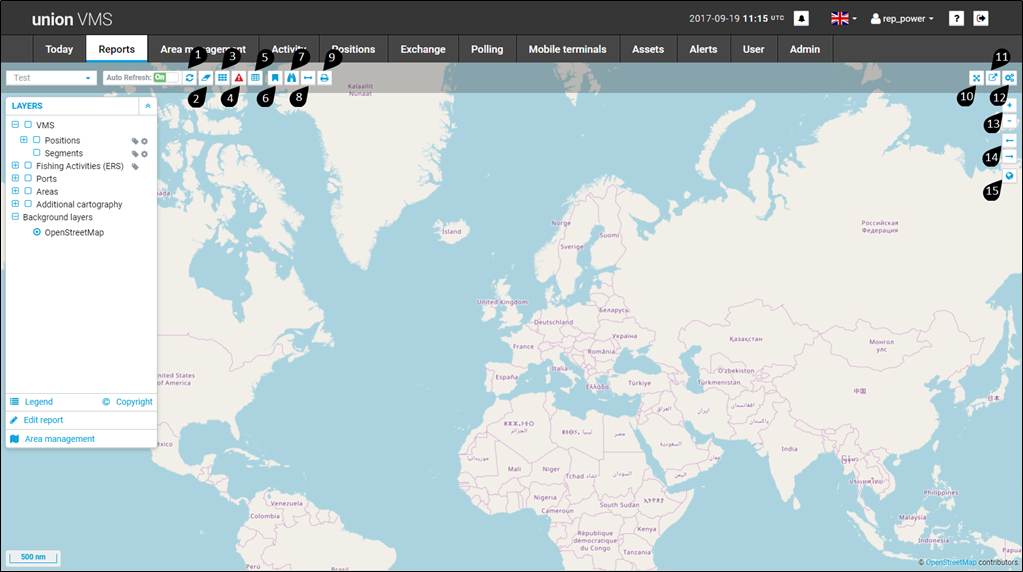
| 1 Refresh | 2 Eraser – Clear map highlights | 3 Enable map graticule | 4 Fetch alerts from current map | 5 Open tabular view |
| 6 Bookmarks | 7 Search places | 8 Measure distance | 9 Export map | 10 Toggle full screen |
| 11 Open map on new tab | 12 User preferences | 13 Zoom in/Zoom out | 14 Previous extent/ Next extent | 15 Zoom to full extent |
Measure distance
Allows calculation of estimated time of arrival based on the criteria selection of measure configuration panel (supported units are meters, nautical miles and miles):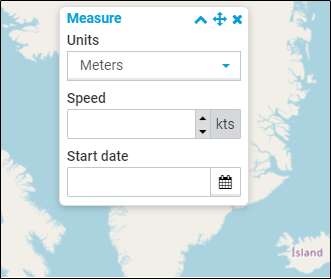
...
 - click on the details button to open the summary view of the trip as shown below:
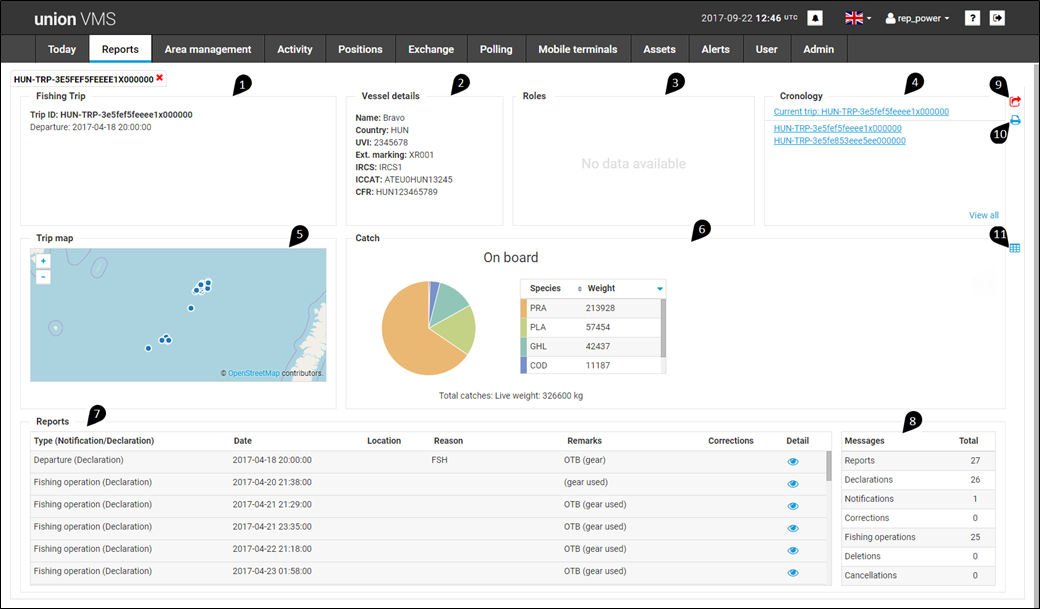
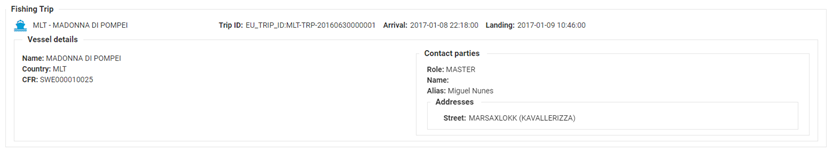
| 1 Fishing Trip - displays the details of the current trip |
| 2 Vessel details - displays the details of the Vessel |
| 3 Roles - displays the "master" details of the vessel |
| 4 Cronology - displays the list of available trips |
| 5 Trip map - displays the fishing activity deatils on the map |
| 6 Catch - displays the details of all the catch in charts and table format |
| 7 Reports - displays the list of fishing activities in the current trip |
| 8 Messages - displays the statistics of reports in the reports panel |
| 9 back button- to go back to the trips table view |
| 10 print - prints the trip summay report |
| 11 table icon - on click will take to the catch details page |
Catch Details
catch details page display the details of the cathes in the tabular format.
...
Note: "select area", "select assets" and "select fishing activity data" are same as the filters of standard report. please refer the standard report for the detailed description.
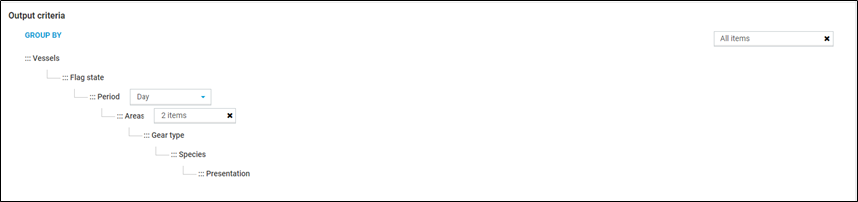
Output Criteria Filter
Filters can be added from the right side dropdown and then all the selected options are displayed in a tree structure.See illustration in picture below
Section 6 Positions
...
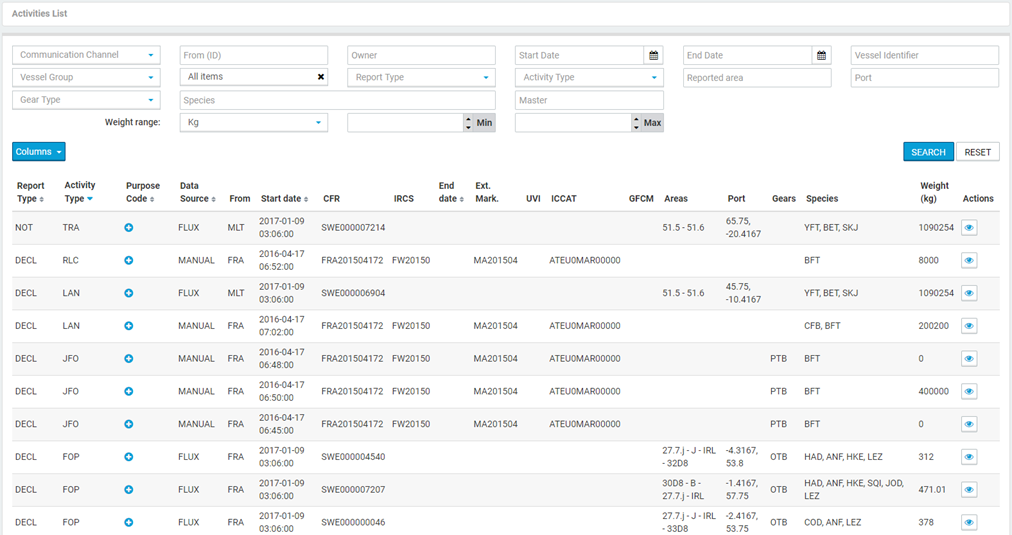
When the user accesses the activity tab, the first view is the activities list where the user can search for fishing activities.

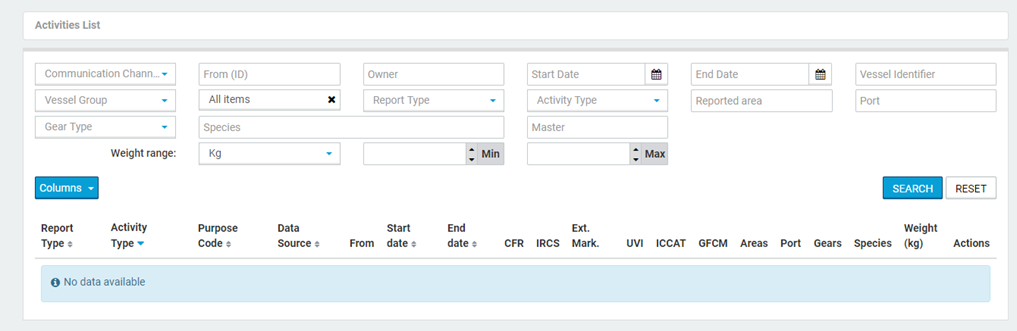
After the button is pressed, the list of fishing activities is displayed according to the applied filters.
Filters
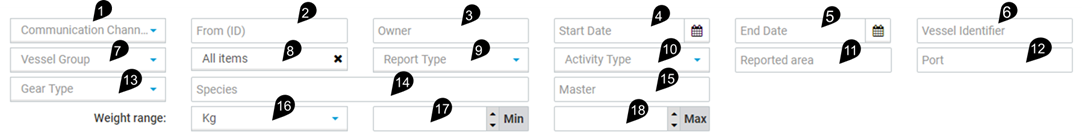
| Field type | Description | |
|---|---|---|
| 1 | Communication Channel | Data source |
| 2 | From (ID) | Country code |
| 3 | Owner | |
| 4 | Start Date | |
| 5 | End Date | |
| 6 | Vessel Identifier | |
| 7 | Vessel Group | |
| 8 | Purpose Code | |
| 9 | Report Type | Notification or declaration |
| 10 | Activity Type | Fishing activity type |
| 11 | Reported area | |
| 12 | Port | |
| 13 | Gear Type | |
| 14 | Species | |
| 15 | Master | |
| 16 | Weight range - Unit | |
| 17 | Weight range - Min | |
| 18 | Weight range - Max |
...
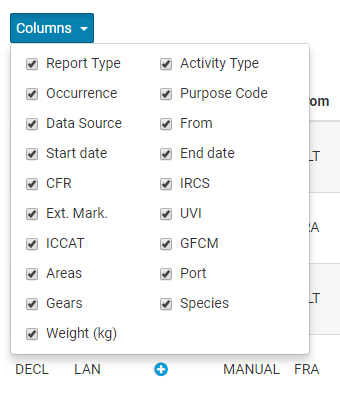
In order to make easier to see only the most relevant columns, the user can hide columns from the table:
Fishing activity
From the activities list, it’s possible to access its details by pressing the  button.
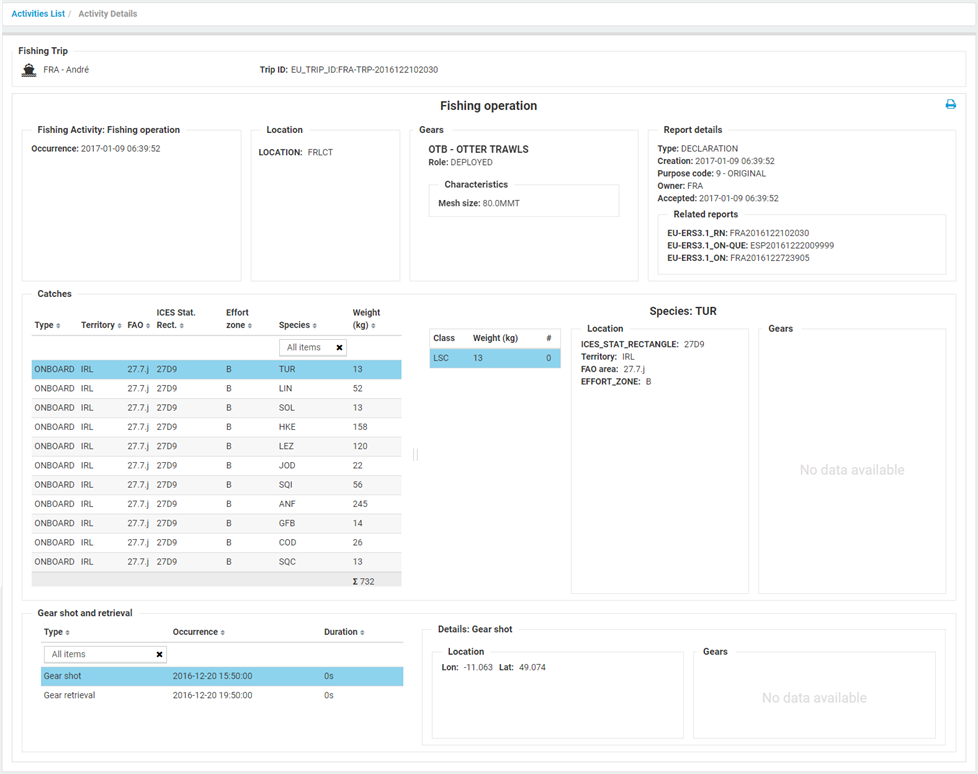
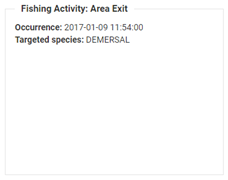
There are many types of fishing activities:
...
Describes the global details of the fishing activity.
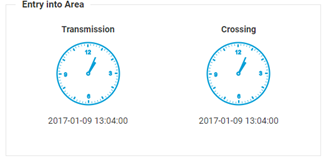
Area information
Displays the times about the area entry.
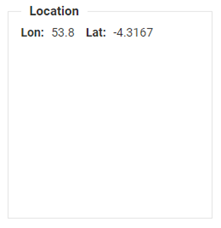
Location
Tells the locations where the fishing activity occurs.
Gears
Describes the gears used in the fishing activity.

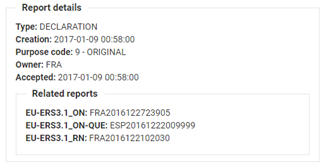
Report details
Describes the report document details.
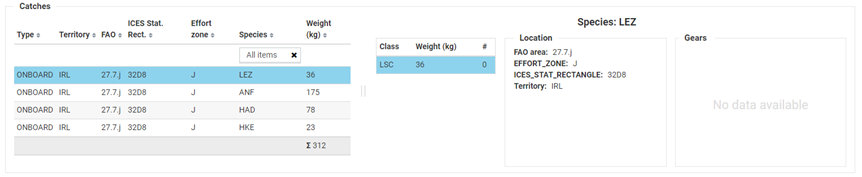
Catch details
Displays the information related to the catches.
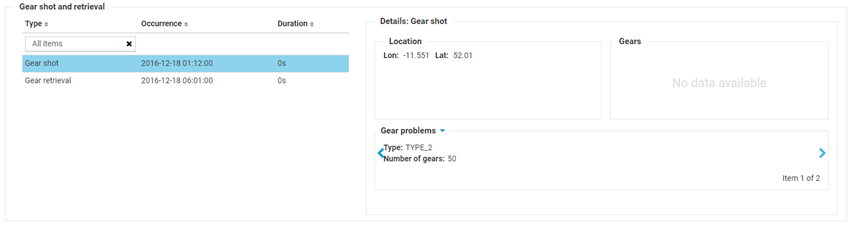
Gear shot and retrieval
Describes all the information related to gear shot and retrieval (including their gear problems).
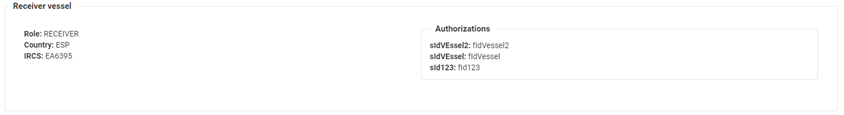
Vessel details
Description related to vessels.

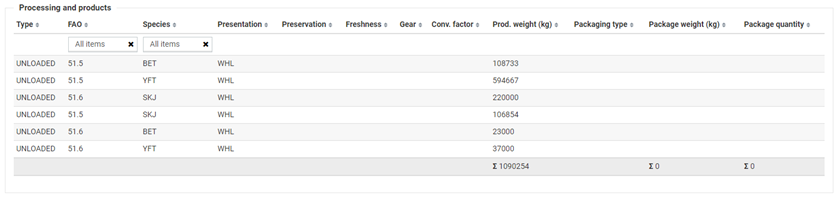
Processing and products
Table with all the information related to processing and products.
Fishing trip overview
Information about the trip of the fishing activity.
Section 13 MDR (Master data register)
...
-hour;
-day;
-week;
-month;
-year.

In case the user doesn’t want to auto-update all the code lists, it can  /
/  in the auto-update column.
...
The admin can synchronize all code lists or only some of them depending of its needs.
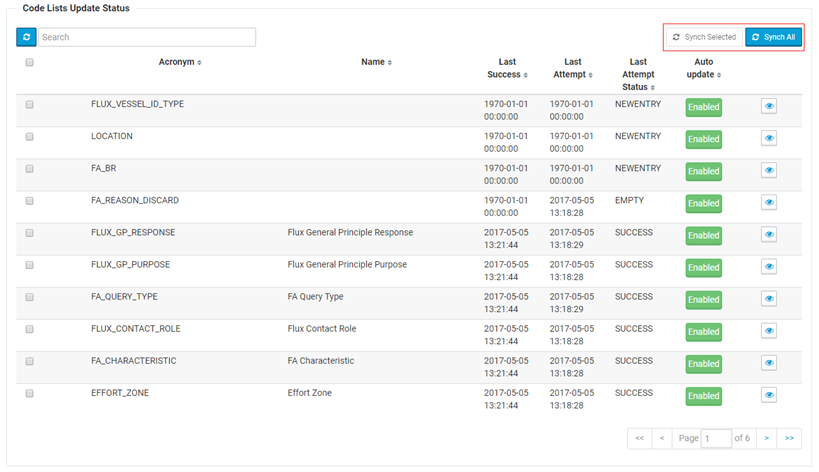
It’s also possible to visualize the contents of every code list by pressing the  button:

Section 14 Configurations
The configurations are present in several levels: admin, user and report.
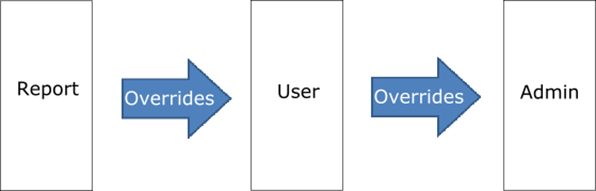
Admin - these configurations are set by an administrator and they are the default settings of the application.
User – the user settings are defined by any user with permissions. These settings override the default ones defined in admin configuration.
Report (map configuration) – settings defined in a specific report. These settings override the previous ones.
There are several sections in every configuration view:
-General settings;
-Map settings;
-Style settings;
-Visibility settings;
-Layer Settings;
-Reference data settings.
General settings
In this section, the user can set the Geoserver URL and the Bing Maps API Key. It’s available in the admin configuration.

Map settings
This section has all the settings related to the maps in the application and it’s available in all the configuration levels (admin, user and report). The auto-refresh configurations are only present at the admin and user levels.

Style settings
It’s possible to stylize the different components in the map (positions, segments and alerts).
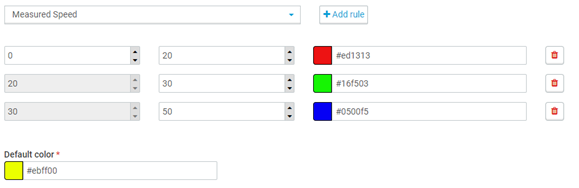
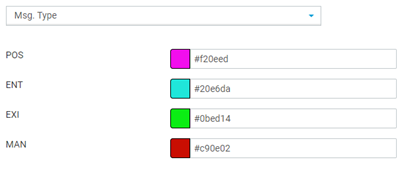
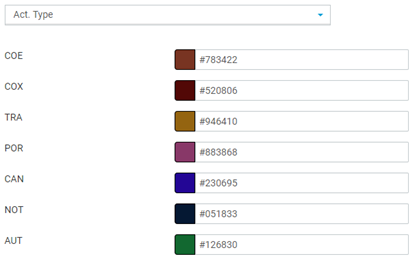
For positions and segments it’s possible to set different colours depending on some properties:
- Flag state;
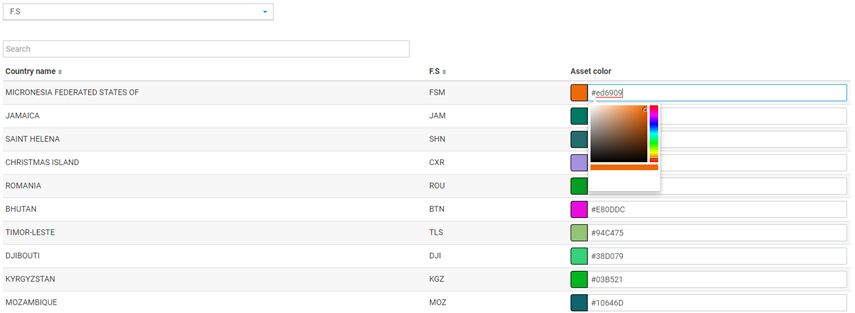
- Measured speed, calculated speed and course;
- Message type;
- Activity Type.
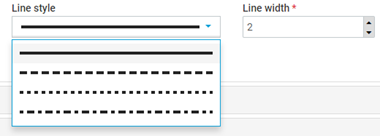
We can also change the segment’s styles in the map but selecting a new line shape and width:
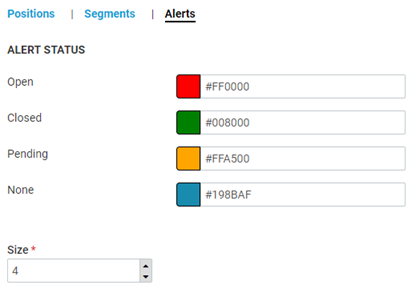
For the alerts, the user can define a different colour for each state and its size in the map:
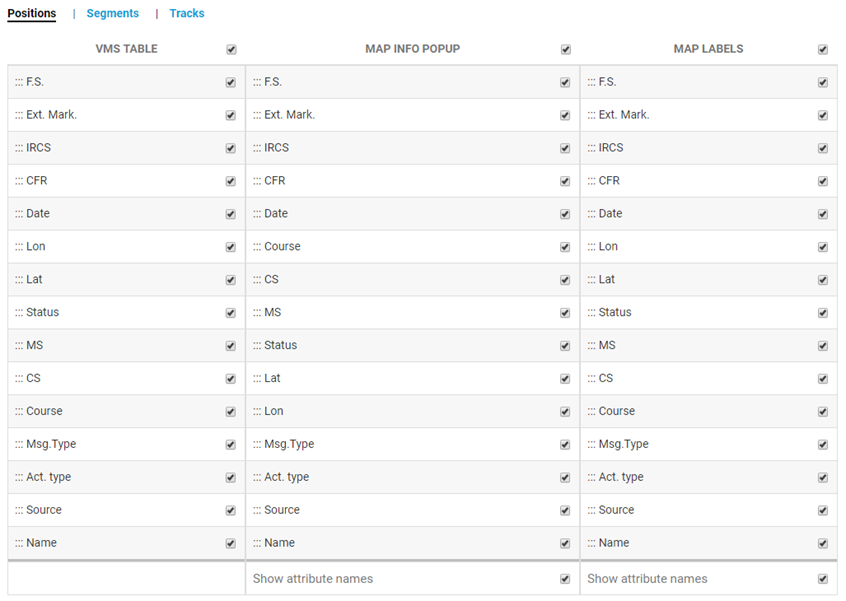
Visibility settings
This section controls the visibility of the properties in the vms table, popups and labels from map. These settings can be applied differently to positions, segments and tracks.
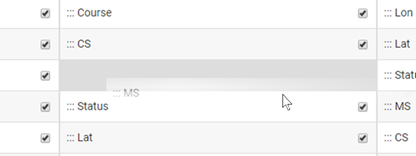
It’s also possible to change their order, depending on the user preferences, by dragging the field to another place.
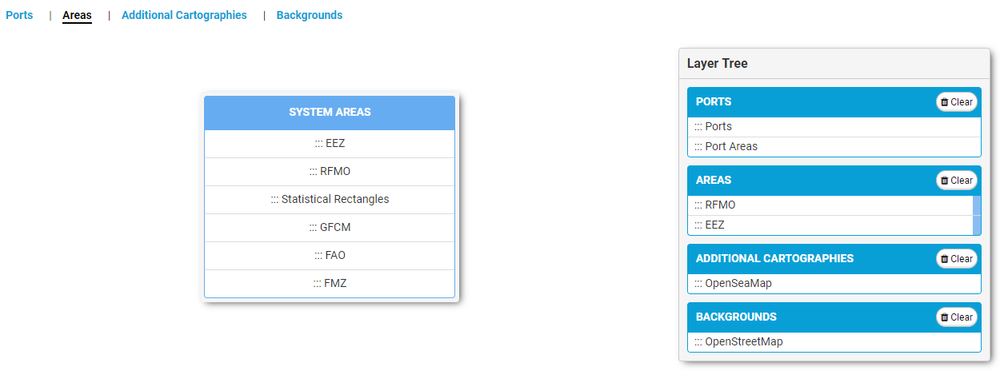
Layer Settings
We have four different types of layer settings. They are backgrounds, Additional cartographies, areas and ports.
- The layer selection is done by dragging the item from the left side list to the right side list of the same category.
- At least one background layer should be selected.
The examples of all types of layer settings are shown below:
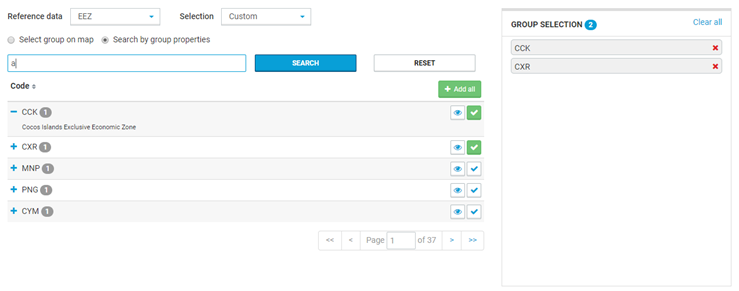
Reference data settings
This section manages the visible areas in every reference data layer. The user can selected them all or customize its selection by selecting only some areas in the following ways:
- The user can select the areas either in the map
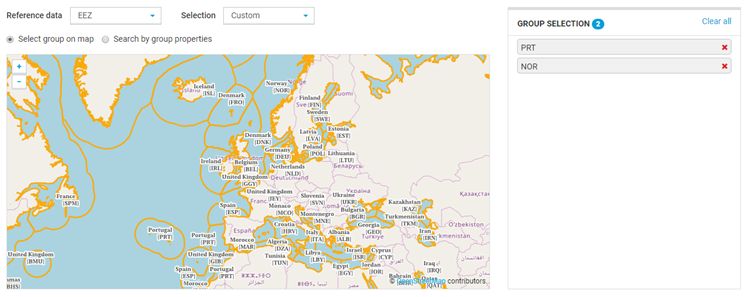
- Or it can do a search
Section 15 Glossary
| Term as used in Union VMS | Explanation |
|---|---|
| Application | it is a computer program designed to perform a group of coordinated functions, tasks, or activities. An application can be linked to USM. If so, it means that: The application delegates the user authentication task to USM; The application can request to get or to verify the access rights of a user; The application exposes through a USM service a set of information used by USM to create user contexts; |
| Communication channel | A medium through which a message is transmitted to its intended audience. A communication channel in USM is attached to an endpoint and it specifies the type of messages that could be transmitted through. |
| Context | a context is always for a user but a user may have multiple ones. It is a container of three elements defining his framework for one or multiple applications. In basic terms, the container defines the WWH for each user: 'What can he do', 'What can he see', 'How he wants to see data'. The three elements are: Role: list of permissions to limit the actions of the user (The first W). It is the only mandatory element of a context; |
| Dataset | it is a business information of an application that can be used to limit the access to data for a user, so a kind of filter. An application linked to USM may register in USM the list of his datasets that are used to create the context of a user; |
| Endpoint | it is a technical node in a network used for message exchanges. Technical information is stored in USM at the level of an organisation. |
| Feature | it is a function of an application. An application linked to USM must register in USM the list of his features that are used to give permissions to a user; |
| IDM system | Identity Management system used mainly to manage user data and credentials. |
| LDAP | Lightweight Directory Access Protocol system used to share corporate data like user information across an organisation or over internet. |
| Module | it is a synonym of "application" but this notion implies usually that a module is linked to a parent application. |
| Option | it is a parameter of an application that can be used by users to customize the layout (color of lines …) or the behaviour (refresh rate of a report …) of the application. An option has always a default value. When included in a user context, the option (with a specific value chosen by the user) becomes a user preference. An application linked to USM may register in USM the list of his options that are used to configure the context of a user; |
| Permission | it is a feature in a role affected to a user; |
| Profile | it is the set of all contexts attached to a user; |
| Role | it is a set of permissions on one or multiple applications; |
| Scope | it is a set of datasets from one or multiple applications. The scope is defined to limit the access to data when used in a user context; |
...